New AI Technology Offers Faster and More Accurate Brain Image Analysis in Individuals with Neurodegenerative Diseases
A research team at the University of Iceland has developed a novel technique, Region-based U-nets, capable of analyzing deep brain atrophy with unprecedented speed and accuracy. Published in NeuroImage:Clinical, the study demonstrates how this new AI method significantly reduces computational demands while outperforming traditional analysis. The innovation holds great promise for improving early diagnosis and clinical research for conditions such as Parkinson’s disease and MSA.
A research team at the University of Iceland has developed a new and powerful deep-learning method, Region-based U-nets, which makes it possible to identify and measure atrophy of deep-brain structures on magnetic resonance images (MRI) with significantly greater accuracy and speed than previous approaches. The study, conducted by PhD student Mengyu Li under the supervision of Lotta María Ellingsen, was recently published in the journal NeuroImage: Clinical (see here: https://www.sciencedirect.com/science/article/pii/S2213158225000774).
The method reduces computational demand compared to earlier techniques and provides consistent results across large datasets. The research team hopes that the method may contribute to advances in research and clinical diagnosis of neurodegenerative disorders, such as Atypical Parkinsonian Disorders, and improve opportunities for early detection.
A novel approach to regional segmentation of brain images
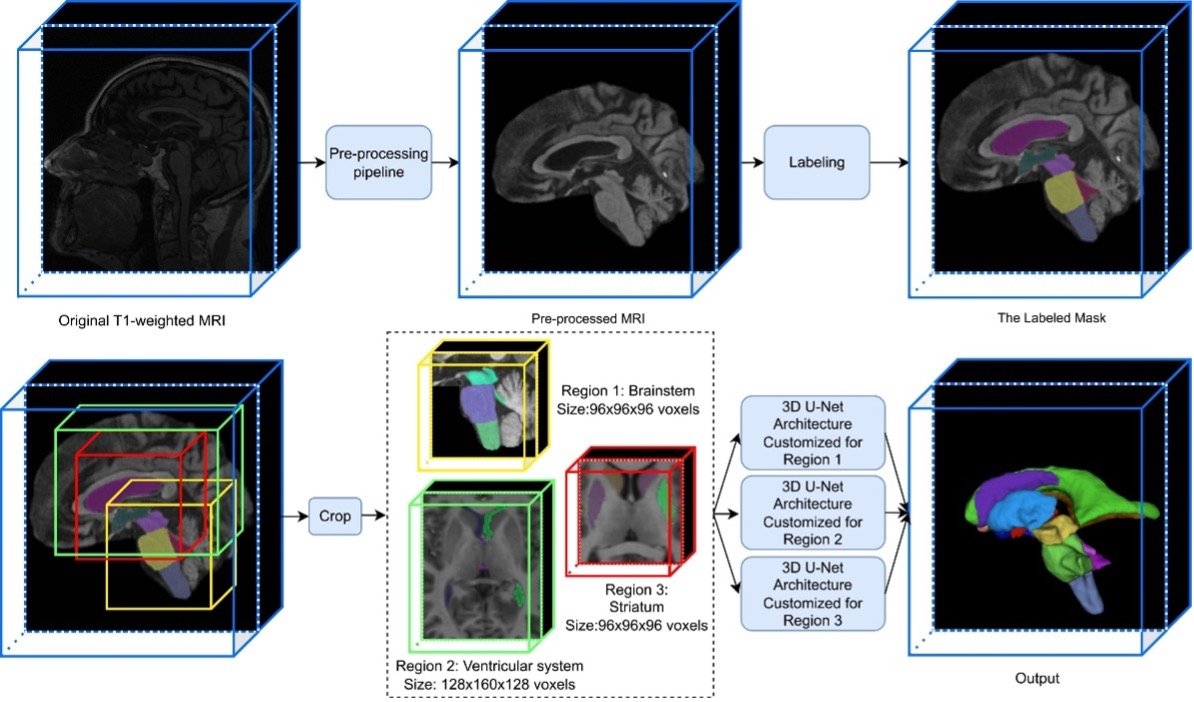
Region-based U-nets uses multiple customized 3-dimensional (3D) neural networks instead of a single large network (see Figure 1). By dividing brain images into distinct and well-defined anatomical regions, including the brainstem, the ventricular system, and the striatum, the method reduces the computational load and memory requirements that typically accompany image analysis techniques operating on large 3D brain volumes.
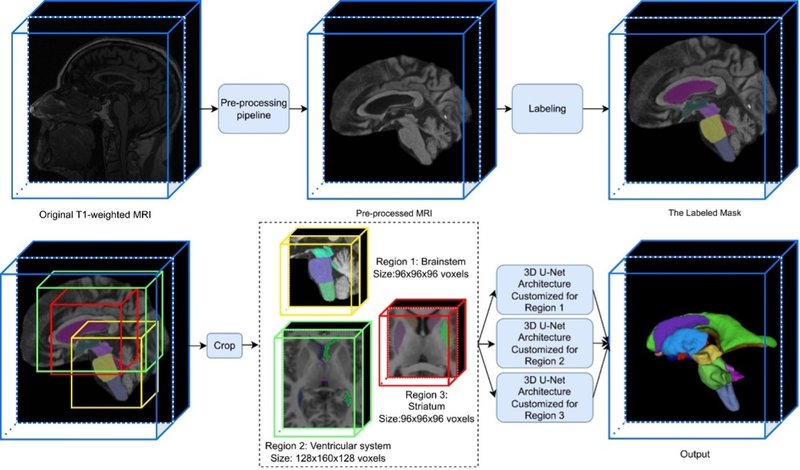
Figure 1: The figure shows the complete image-processing pipeline, from the raw MRI head scan to the labeling of 12 brain regions in 3D. (Figure from Mengyu et al, NeuroImage:Clinical, 2025).
Results
The method was evaluated on three different datasets, including a multi-site clinical dataset with 660 participants, both healthy individuals and individuals with movement disorders: Multiple System Atrophy (MSA, types C and P), Parkinson’s disease (PD), Progressive Supranuclear Palsy (PSP), and healthy controls (HC). Region-based U-nets achieved high accuracy, including a mean Dice similarity coefficient of 0.90 across 12 different deep-brain regions. Training of the network that previously took several days can now be completed in just a few hours, and results for each individual are generated in a few seconds.
Figure 2 shows volume measurements taken from two brain regions, the midbrain and the pons, in the five patient groups. The results are highly promising, suggesting that such volumetric measurements, together with other clinical assessments, may be useful in the differential diagnosis of these disorders.
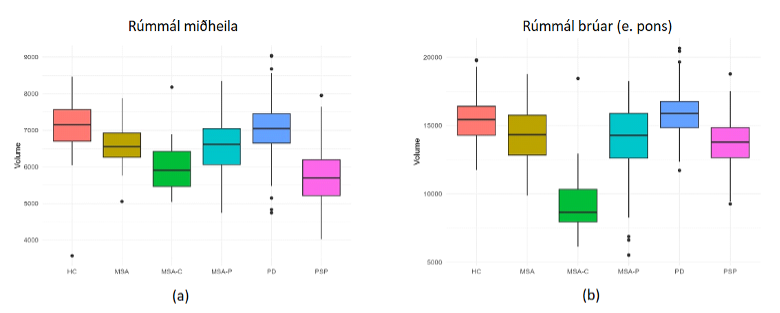
Figure 2: The figure shows (a) midbrain volume and (b) pons volume calculated using the Region-based U-nets for different groups: healthy controls (red), unclassified MSA (yellow), MSA-C (green), MSA-P (teal), Parkinson’s disease (blue), and PSP (magenta). In panel (a), we see that individuals with PSP and MSA-C exhibit significantly greater atrophy in the midbrain compared to the reference groups. In panel (b), we see that individuals with MSA-C show significantly greater atrophy in the pons compared with the other syndromes. (Image from Mengyu et al., NeuroImage: Clinical, 2025).
From research tool to diagnostic support
Manual labeling of brain structures in MRI is still considered the gold standard for accuracy; however, it is extremely time-consuming and produces highly variable results between raters. Region-based U-nets overcomes this issue with automated labeling that is fast, accurate, and provides fully consistent results on repeated analyses of the same image. The method can also detect subtle changes in the brain that the human eye struggles to see. It may therefore prove to be a valuable tool in both large-scale scientific studies and in the diagnosis of neurodegenerative diseases, where early signs are often subtle and difficult to identify.